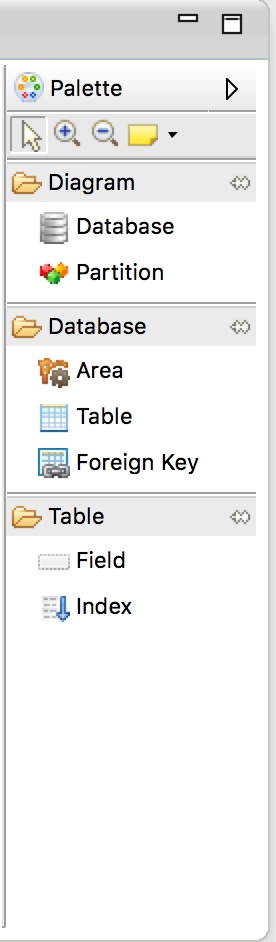
Diagram Palette
The diagram palette of the ERD editor allows one to create new elements on the diagram canvas, those includes all database related elements like area, sequence and tables but also notes and plain text boxes that can be used to further enrich the diagram.
The palette is docked inside the diagram editor and hence only visible when a database diagram is open in the editor, it can still be hidden if needed by using the top-right slider menu.
|
Arrow pointer is used to select diagram elements, depending on selection other views - like the properties view - and contextual menu is updated. |
Plus, minus magnifier buttons zooms in and out the diagram content. To make more room in a diagram to get a bird view on related tables another option is to hide index or even field compartments on table elements. |
|
The yellow post-it button allows creating notes or simple text boxes on the diagram canvas. |
|
Database icon on the diagram group can be used to add a new database on the diagram. Each diagram has a database element that it's attached to the diagram - the diagram shows direct content of that database, however inside a diagram file there can be multiple diagrams/databases. There is always a main (root) database that is attached to the main diagram - the one that is shown when you open the diagram file inside the editor. New databases can be added only inside that main diagram/database, there is no limit on the number of databases that can be added though. When double clicking on a database element the associated diagram opens in a new editor page, all open editors working on the same diagram file are kept in sync since all are using the same resource. |
|
Partition icon on the diagram group can be used to create a sub-diagram, a logical view of a database subject area. A partition behaves very much like a database element as it does have a diagram attached, it can be open with double click on the partition element, and it can contain tables on its own to avoid overcrowding the main diagram. However, it is just a logical grouping designed to make it easier to visualize large databases with a considerable number of tables and relations. New partitions can be created only inside a database - including the root one - it is not possible to further partition an existing partition just to avoid deeply nested partitions, there is no limit on the number of partitions that can be created inside a database. |
|
Area icon on the database group will create a storage area, very much like a partition but unlike it this also correspond to a physical database storage area. Just like partitions, areas can be created only inside a database - including the root one - but not inside other partitions, physical (area) or logical. All elements created inside an area will be defined for that area when exporting a database definition, unless another area was specifically set. |
|
Table icon on the database group can be used to add new tables inside the diagram canvas. New tables can be added in any diagram, be it physical (database, area) or logical (partition). While a table can only be contained inside a diagram it can still be made visible inside any number of logical views (partitions) by importing it as a shortcut, there will be a shortcut decorator visible in those cases. |
|
Foreign Key icon on the database group can be used to define relations between tables. Relations can be defined between any two tables from the same diagram, creating relations between tables from different databases is supported. Because of that all relations are kept inside the main database and only relations between tables - or table shortcuts - of the open diagram are visible on the canvas. |
|
Field icon on the table group can be used to add new field(s) on a table inside the diagram canvas. |